Project Overview
This project focused on developing an automated Excel dashboard that analyzes transportation data, tracks operational performance, and identifies route efficiency trends. The dataset underwent extensive cleaning and transformation to remove inconsistencies and prepare it for analysis. The dashboard integrates automation, allowing real-time updates that help logistics and transport teams make faster, data-backed decisions for optimizing routes, reducing fuel costs, and improving delivery timelines.
Dashboard Views
Insights & Recommendations
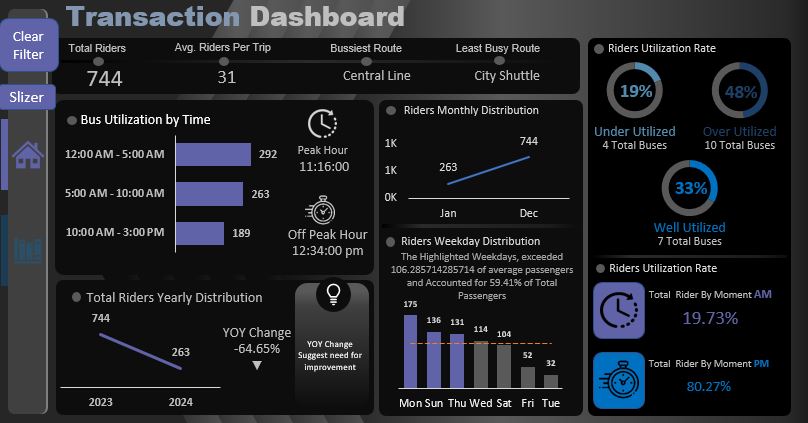
- Ridership Trend Year-over-year ridership declined by 64.65%, signaling reduced passenger activity or incomplete data capture. Ridership peaks at 11:16 AM and drops in early afternoon, indicating morning commute dominance and possible off-peak inefficiency.
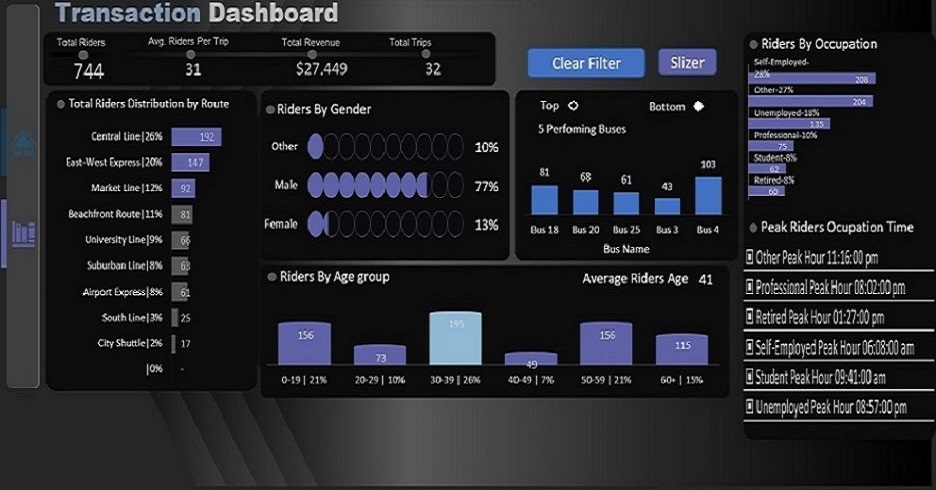
- Route Utilization The Central Line remains the busiest route, while City Shuttle records the least usage. Nearly half of the buses (48%) are over-utilized, while 19% are under-utilized — revealing an imbalance between service supply and rider demand.
- Weekday Demand Monday and Tuesday account for over 59% of total ridership, while Friday shows the lowest utilization — suggesting potential for schedule consolidation or targeted weekday promotions.
- Operational Recommendations
- Adjust bus schedules to align with peak and low-demand hours.
- Reallocate underutilized buses to high-traffic routes.
- Introduce fare incentives for off-peak travel to stabilize load balance.
- Investigate the YoY decline to verify if it’s caused by service issues or incomplete reporting. - Performance Optimization
- Integrate real-time bus tracking and utilization alerts.
- Establish dynamic routing models that respond to real-time passenger demand.
- Strengthen data collection for continuous performance monitoring.